
The Best Webflow Analytics Tool: Why Posthog is My Top Choice
Nobody cares about analytics, but your business depends on getting the right user insights to make decisions.
I have a love-hate relationship with analytics tools. They are expensive, fragmented, and overwhelming. Yet, I depend on them to gain insights about users and understand how to better support them.
Choosing the right Webflow analytics tool can make all the difference, especially when it comes to understanding website traffic tracking and user behavior.
One day, Roman, a former colleague, told me about Posthog, and it immediately caught my attention. Posthog combines ease of use with powerful features like heatmaps, surveys, and A/B testing—all in one place, providing a complete, actionable view of user insights and website traffic tracking. Here's why Posthog should be your go-to analytics tool for Webflow.
Why Posthog is the Best for Webflow Analytics
Posthog makes Webflow analytics easy and effective:
- Ease of Use: You can start tracking with minimal setup. Posthog even offers templates to get you started quickly. Find ready-made templates tailored to needs like e-commerce, user engagement, and website analytics tracking, making it easy to start with Posthog. Explore templates here.
- Free for Smaller Websites: Posthog is free for websites with fewer than 10,000 monthly users (an average of 100 events/user). This makes it a great starting point for ambitious businesses and startups.
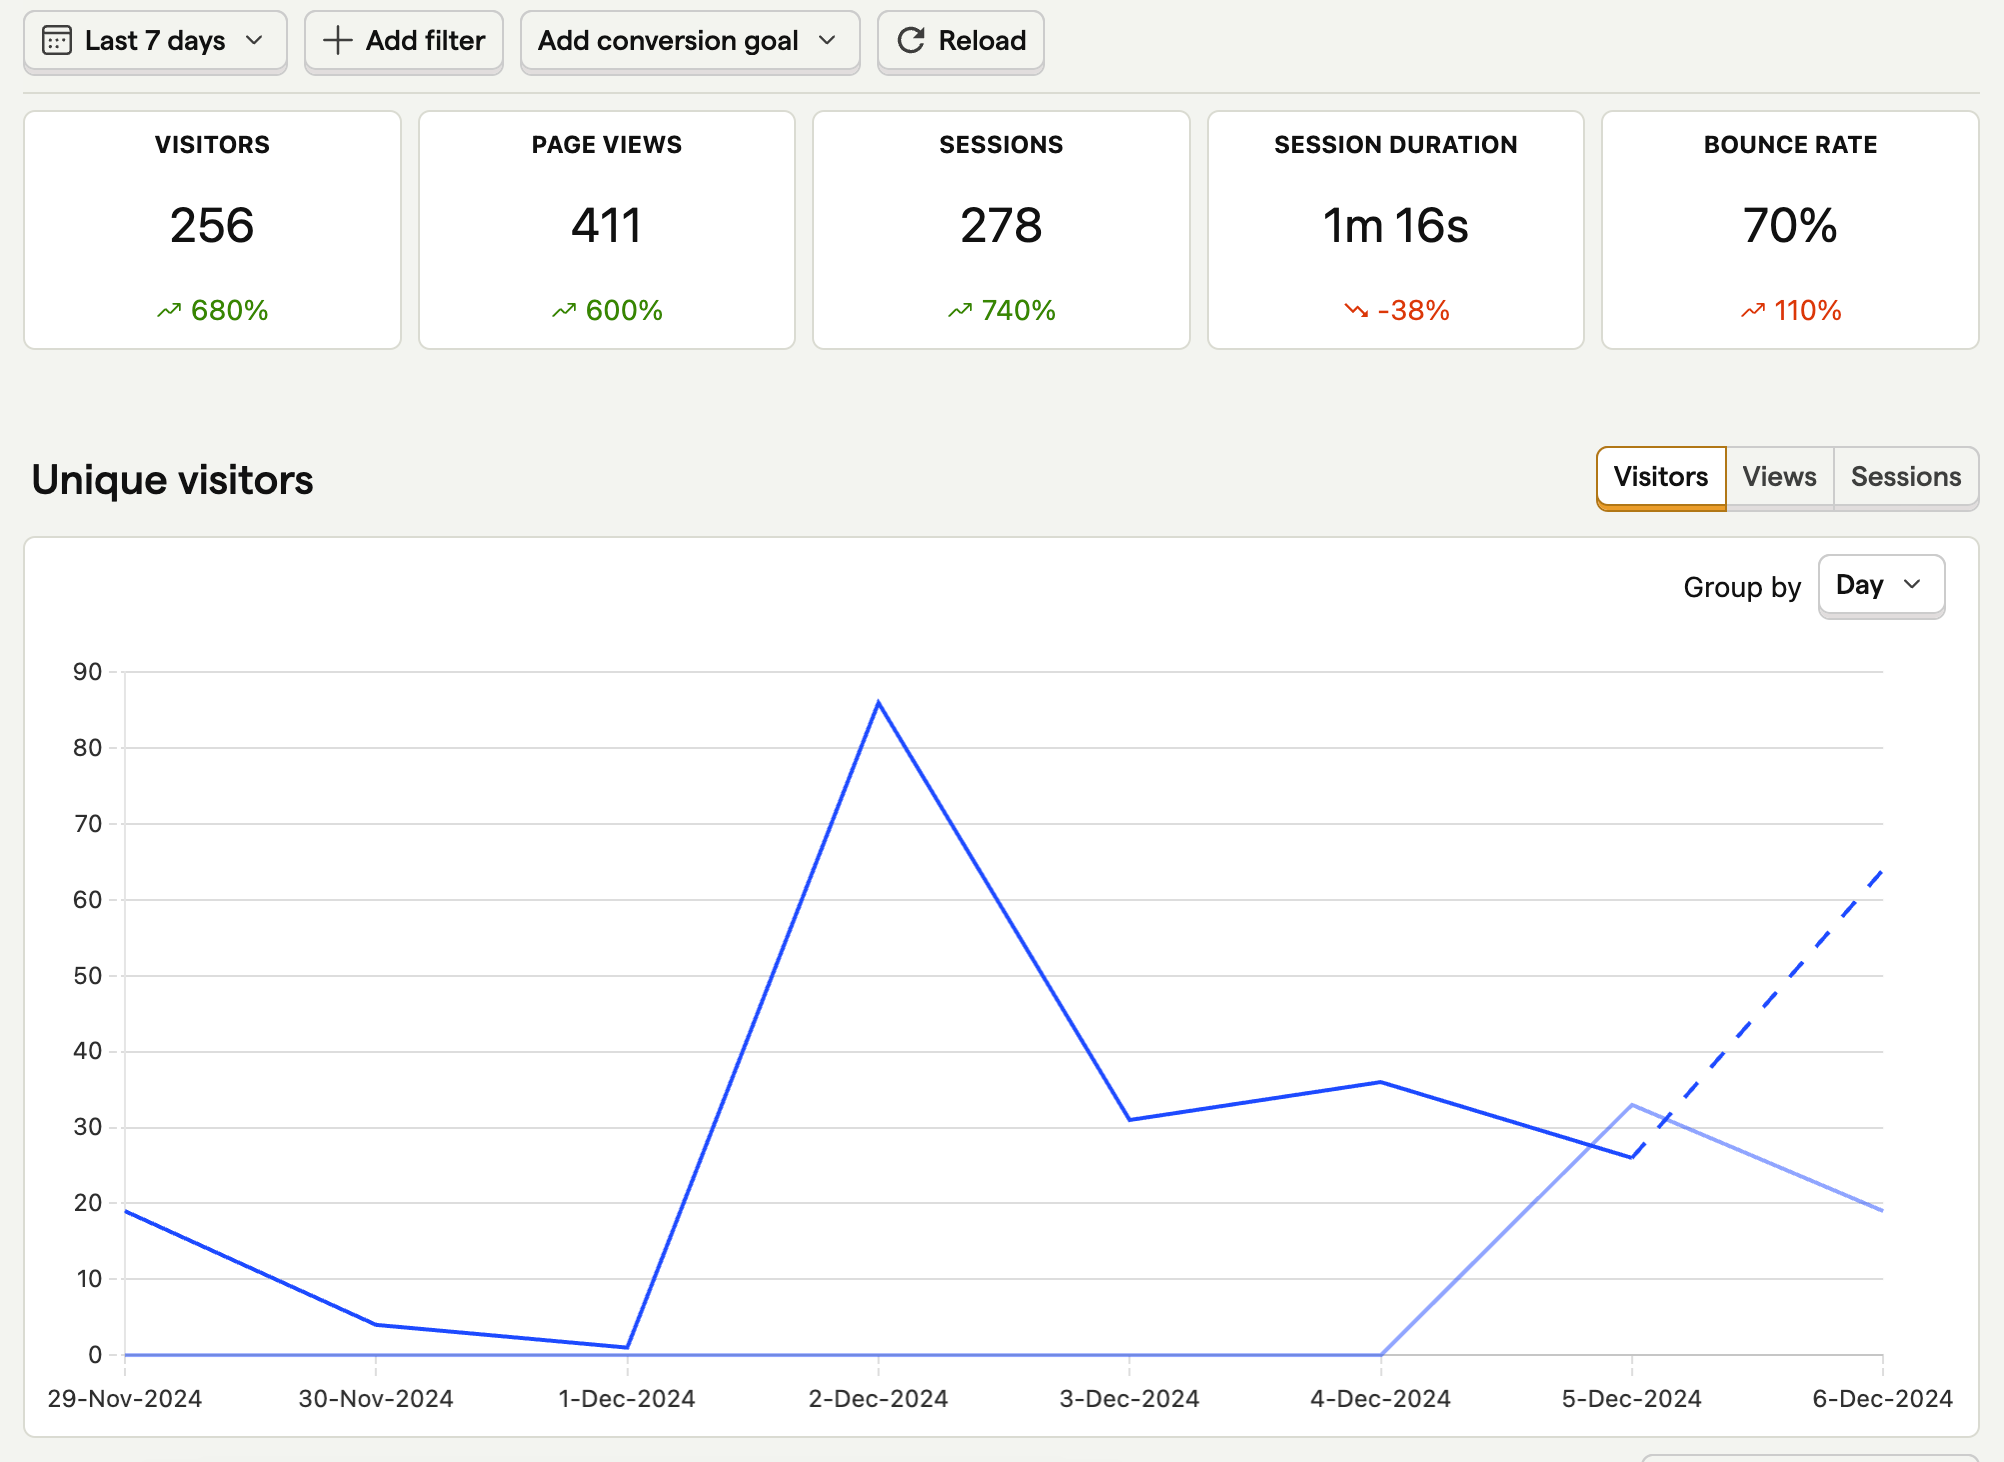
- All Your Insights in One Place: Posthog offers heatmaps, surveys, and A/B testing tools for Webflow analytics, all under one roof. Instead of juggling tools like Hotjar, Typeform, and Google Analytics, you get all insights in one place, saving time and hassle.
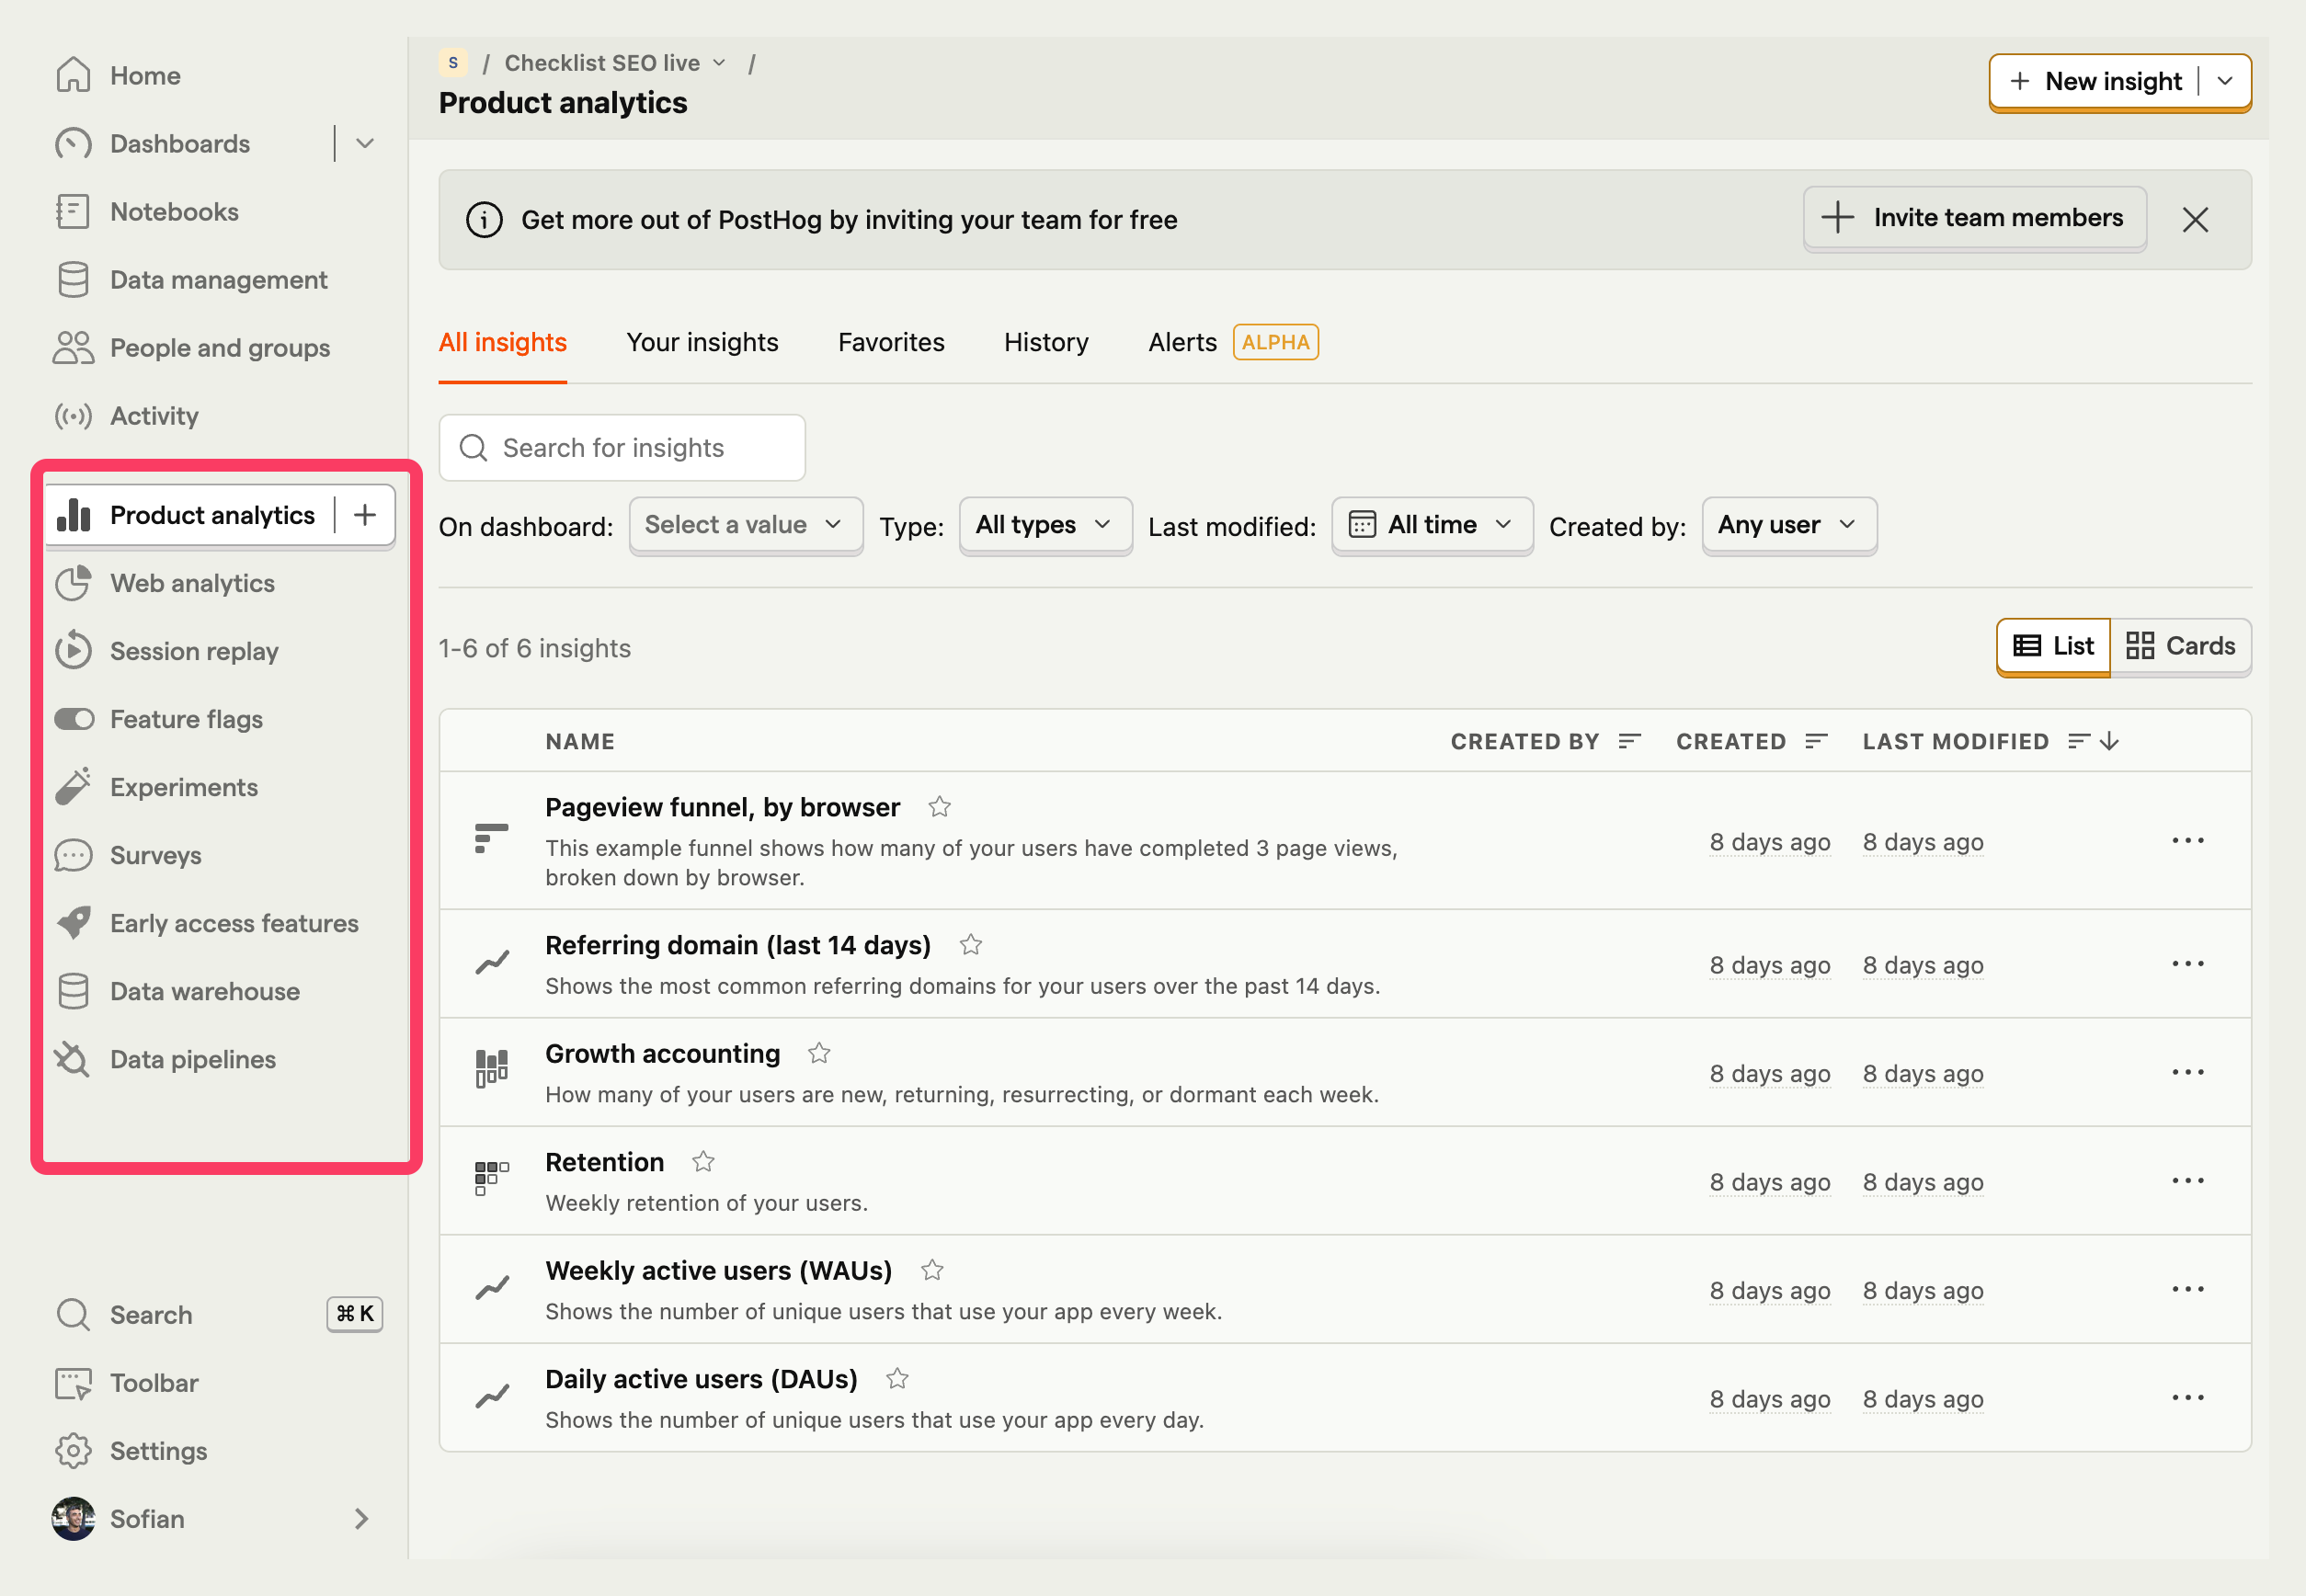
- Product Analytics Included: Beyond just website tracking, Posthog can also provide insights for your digital product, giving you a complete understanding of your user journey. Imagine gaining insights from the first Google touchpoint to when users recommend your product to friends. Posthog makes this kind of full-spectrum tracking possible, helping you see and optimize the entire user experience while improving Webflow website traffic tracking.
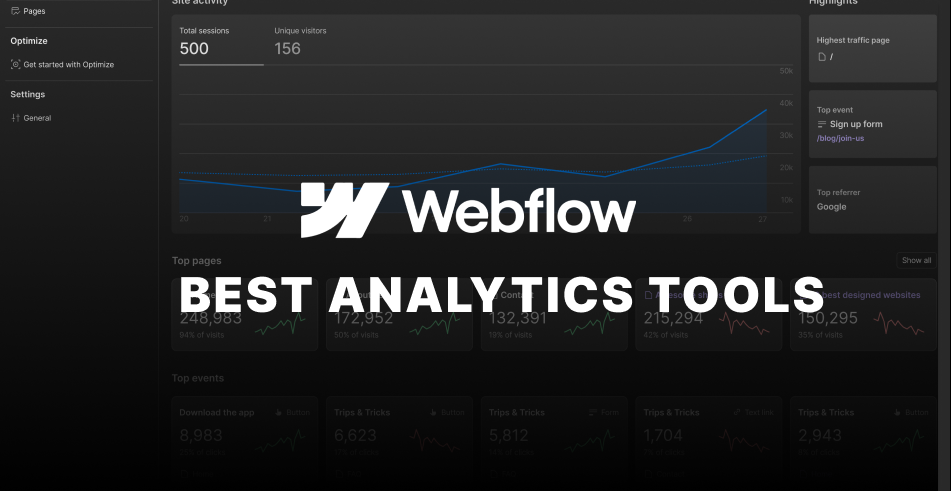
Posthog vs. Webflow Analyze
Posthog and Webflow Analyze serve different use cases effectively:
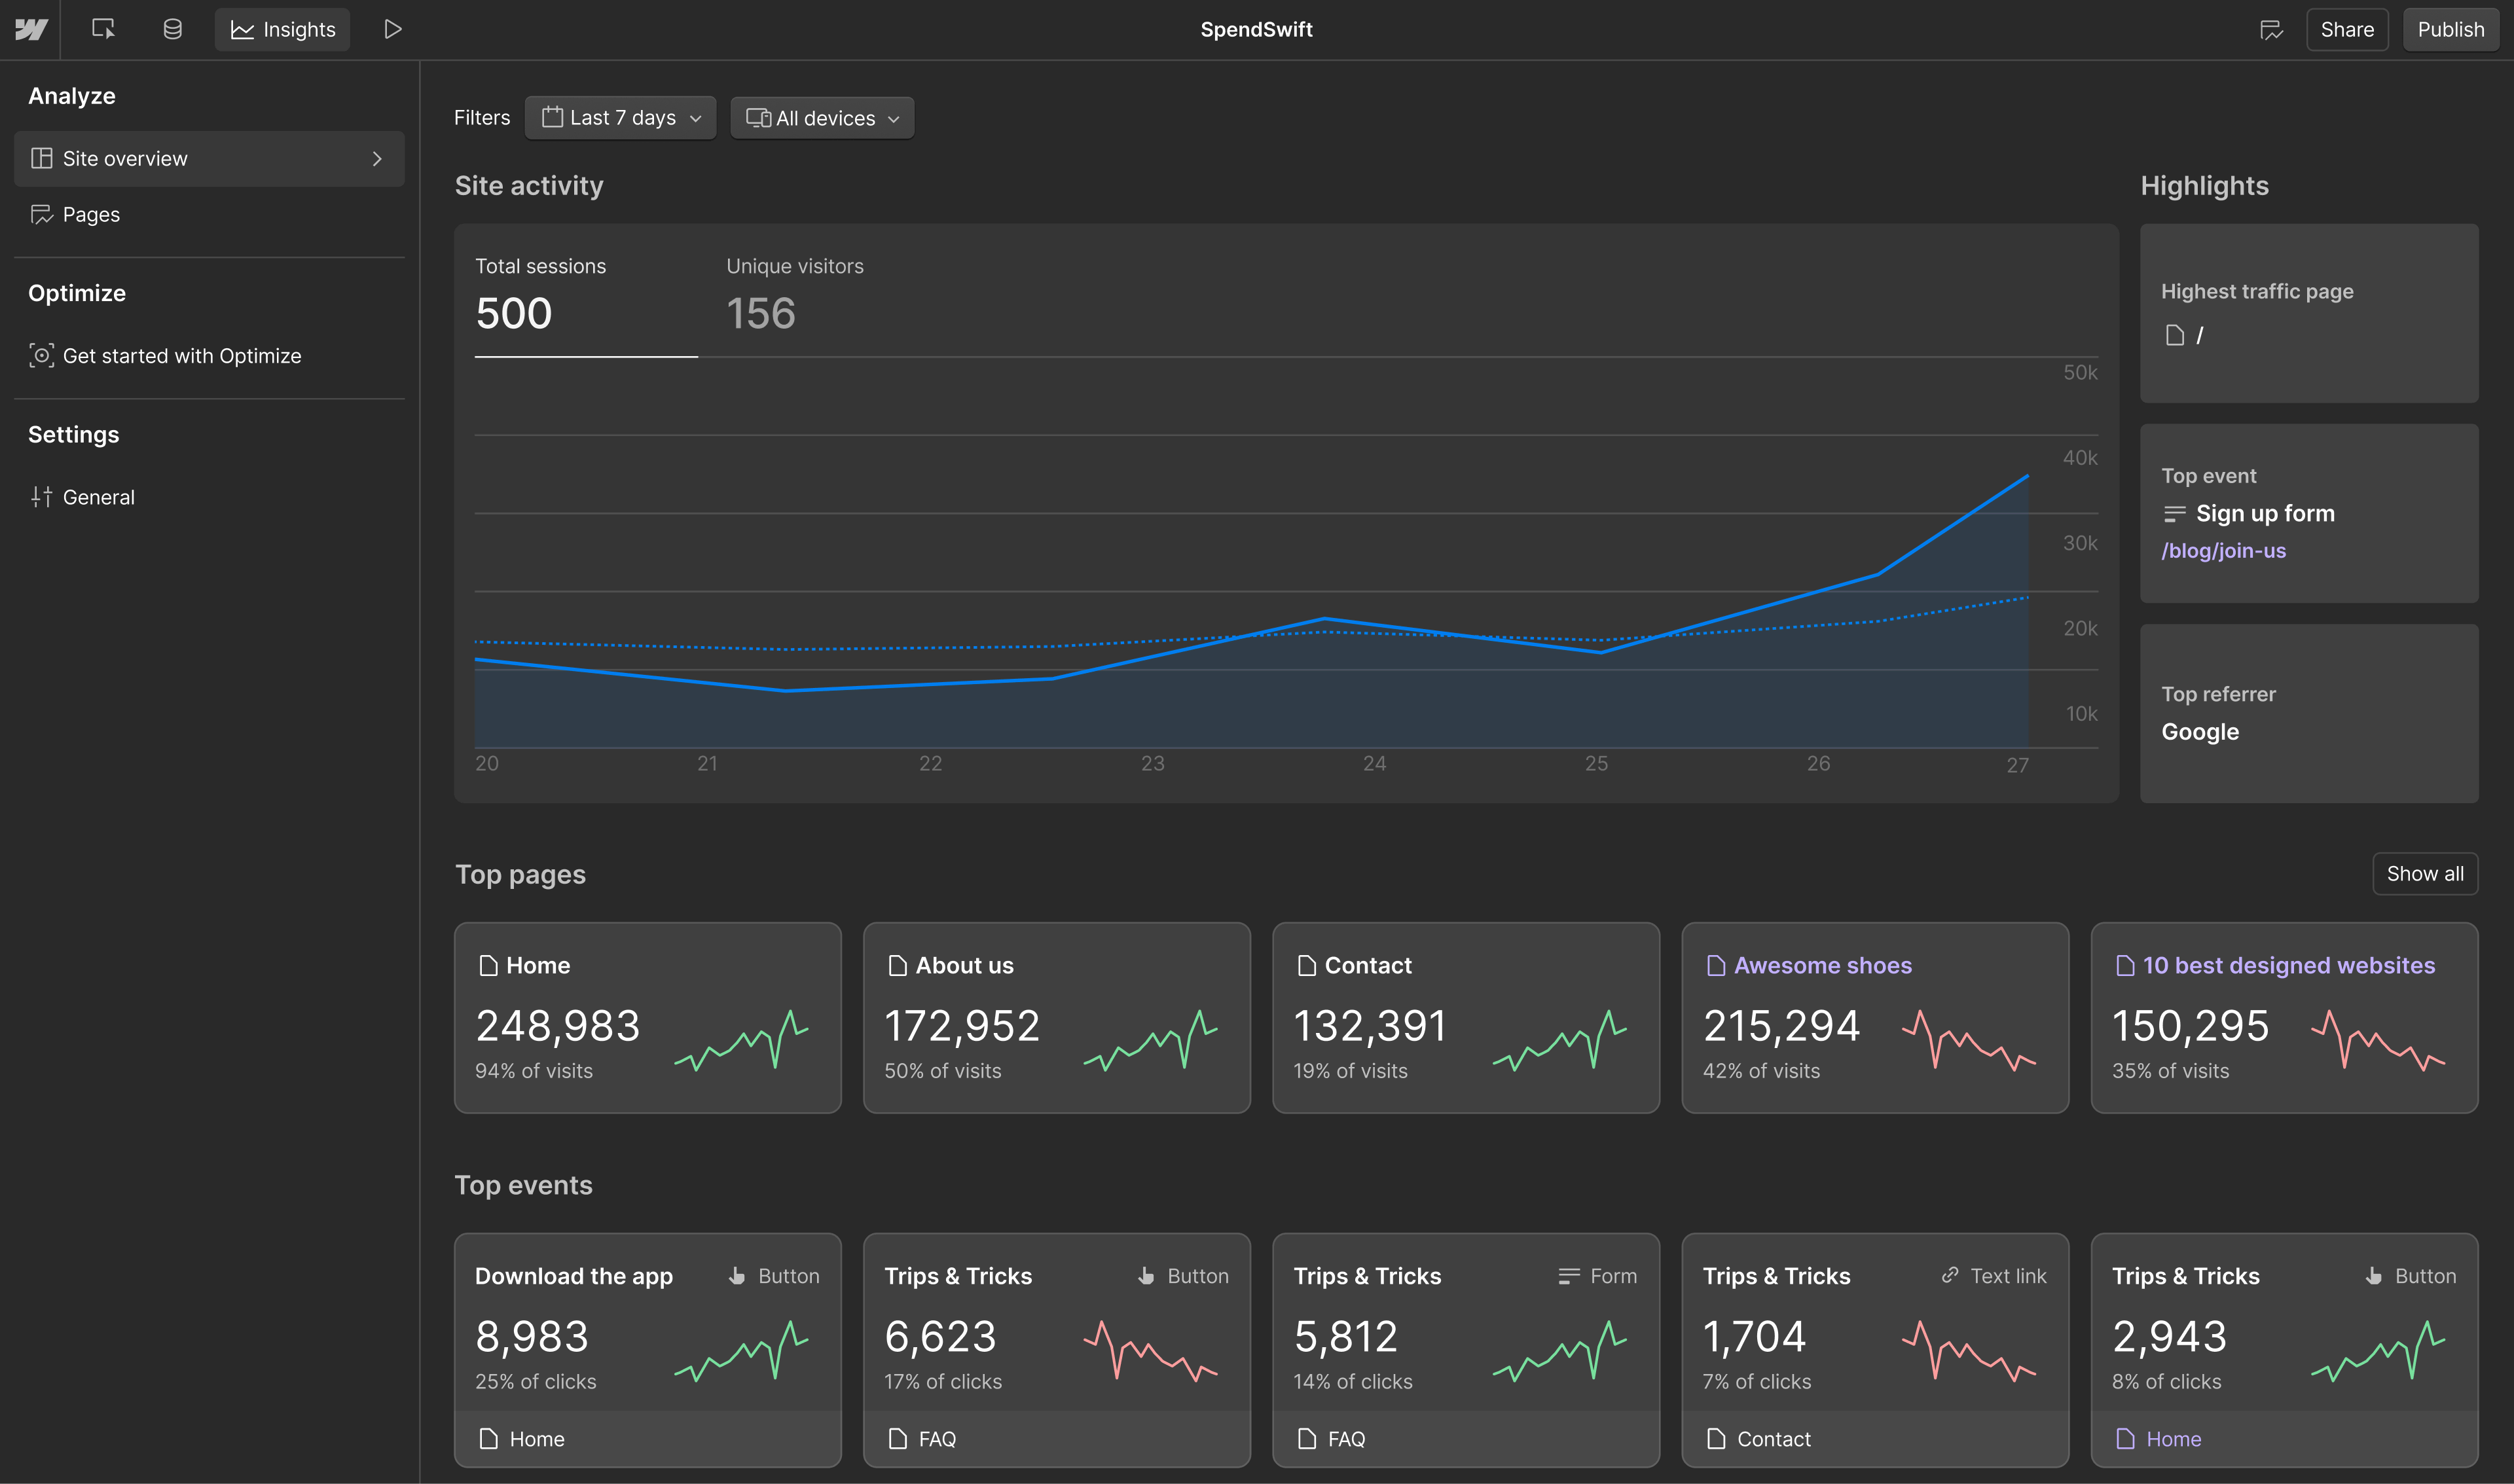
- Webflow Analyze is best for Designers: Webflow Analyze is ideal for designers wanting integrated analytics with no middleman. Its server-side analytics also provide higher accuracy, making it ideal for quick, reliable insights into user behavior.
However, Webflow Analyze cannot set and track goals. It also lacks integration with a broader marketing stack. These limitations make it less suitable for growth-focused strategies.
- Posthog for Marketers: Posthog is ideal for marketers relying on Analytics to track website traffic and drive growth. It offers a rich feature set, seamless integration with ads and martech stacks, and all insights in one place—all for free for smaller sites.
This makes it ideal for marketers looking to extract meaningful insights and drive performance.
Posthog vs. Google Analytics
Comparing Posthog to Google Analytics, Posthog often comes out ahead for Webflow users:
- More Features Out of the Box: You don't need to add complex configurations to access key features. Heatmaps, funnels, and event tracking are all built-in.
- Comprehensive Analytics Without the Overkill: Google Analytics can be overwhelming, especially for smaller sites. Posthog is designed to be powerful yet accessible, giving you what you need without the complexity.
- Scales as You Grow: As your business scales, Posthog keeps up. There are paid plans for advanced use—but you get real value at every growth stage.
Posthog offers a user-friendly, comprehensive feature set for Webflow Analytics compared to Google Analytics, particularly for those seeking actionable insights without complexity.
However, if you exclusively use Google products for your marketing efforts, staying with Google Analytics might be more convenient due to its seamless integration with other Google tools.
How to Get Started with Posthog for Webflow Analytics
Getting started with Posthog on your Webflow site is straightforward:
- Sign Up for Posthog: Create an account on Posthog's website.
- Install the Tracking Script: In your Webflow project settings, navigate to the custom code section and add the Posthog tracking script in the head or body section. The script and detailed instructions are in the Posthog documentation.
- Explore Templates: To quickly set up the tracking you need, start with one of Posthog’s ready-made templates. Check out the available templates here.
- Configure Your Events: Use Posthog’s simple interface to set up key events you want to track, such as button clicks, page views, or form submissions.
- Analyze and Optimize: Once your tracking is in place, use Posthog’s dashboards, heatmaps, and A/B testing features to gain insights and optimize your site for better performance.
With these steps, you'll quickly collect meaningful data to improve your Webflow site.
Conclusion
Posthog makes more sense for marketers on Webflow because it provides in-depth, actionable insights that drive growth, especially through effective Webflow Analytics and website traffic tracking.
While Webflow Analyze works for designers with simple analytics needs, Posthog provides the tools and integrations marketers need to develop and measure successful campaigns.
It’s easy to start, provides a complete picture of your users, and scales with your business, ensuring you have the insights necessary to make informed decisions and maximize growth potential.
Pages
Home
About
Work
Articles
Contact
Articles
Value first product growth
A/B testing limits for businesses
How Google search works
Webflow Analytics tools
Webflow trends 2025
Not result yet, but maybe someday soon :)
Scroll
Open
Close